 |
Cybertelecom Federal Internet Law & Policy An Educational Project |

|
Statistics :: Broadband | |
Data Collections about Network Infrastructure
- Infrastructure
- North American Numbering Plan
- Internet Names and Numbers (DNS and IP Addresses)
- Internet Routing
- Internet Exchange Points
- Internet Interconnection
- Telephone
- Automated Reporting Management Information System (ARMIS)
- Public Safety (911, PSAP, EAS, CALEA)
- Part 68 Customer Equipment
- Equipment Authorization Part 15
- Deployment / Section 706 / Form 477
- National Broadband Map
- Internet Access Service Reports
- Voice Telephone Service Reports
- Fiber Backhaul
- International Circuits / Transatlantic Fiber
- Radio Frequency (deployment, allocation, authorization, antenna location, spectrum inventory)
- Satellite
- Adoption
- Subscriber Charts: Internet Subs by Physical Network
- Performance
- Measuring Broadband America
- Connect America Fund
- Reliability / Outage / Cybersecurity
- FCC Network Outage Reporting System / Disaster Information Reporting System
- DHS Cybersecurity
- DHS Vulnerabilities
- DHS Application of Network Measurement Science
Broadband Data Improvement Act (P.L. 110-385)
Required, in part, the FCC to prepare international comparisons of broadband service. See also Measuring Broadband America; Sec. 706
- "The Broadband Data Im provement Act (BDIA) requires the Commission to include in its annual broadband progress report information comp aring the extent of broadband service capability (including data transmission speeds and price for broadband service capability) in a total of 75 communities in at least 25 countries abroad for each of the data rate benchmarks for broadband service utilized by the Commission to reflect different speed tiers. 24 The BDIA directs the Commission to assess broadband capability in international communities co mparable to U.S. communities with resp population size, population density, to pography, and demographic profile. ect to 25 The Commission is also directed to include a geographically diverse selection of countries and communities including the capital cities of such countries. 26 The Commission must identify relevant similarities and differences in each community, including their mark et structures, the number of competitors, the number of facilities- based providers, the types of technologies deployed by such providers, the applications and services those technologies enable, the regulatory model under which br oadband service capability is provided, the types of applications and services used, business and reside ntial use of such services, and other media available to consumers." International Broadband Data Report (Third) para. 12
- February 2, 2018 International Broadband Data Report (Sixth)
- INTERNATIONAL COMPARISON REQUIREMENTS PURSUANT TO THE BROADBAND DATA IMPROVEMENT ACT, FIFTH INTERNATIONAL BROADBAND DATA REPORT. This is the fifth International Broadband Data Report (IBDR), providing comparative international information on broadband services. (Dkt No. 15-191 ). Action by: International Bureau by REPORT. (DA No. 16-97). IB PDF | XLS | XLS | PDF | PDF
- International Broadband Data Report (Third)
- International Comparison Requirements Pursuant to the Broadband Data Improvement Act International Broadband Data Report , IB Docket No. 10-171, Second Report, 26 FCC Rcd 7378 (2011)
- International Broadband Data Report (First)
- OECD Technical Workshop, Broadband and Its Impact on Consumers and Economies: Developing a New Framework for Future Metrics Oct. 2011
- See also Sec. 706 Inquiry Concerning the Deployment of Advanced Telecommunications Capability to All Americans in a Reasonable and Timely Fashion, and Possible Steps to Accelerate Such Deployment Pursuant to Section 706 of the Telecommunications of 1996, as Amended by the Broadband Data Improvement Act, 26 FCC Rcd 11800, 11812-13 (2011). asking about how to improve the IBDR data gathering process
International
Reports
- FCC Data See Sec. 706 :: Data on Internet Access Service
- OECD
- OECD broadband statistics update, OECD 12/8/2010
- OECD Communications Outlook 2009, OECD 8/11/2009
- The Future of the Internet Economy: A statistical profile, OECD 6/16/2008
- OECD broadband up 18% in 2007 but new report says more could be done, OECD 5/22/2008
- OECD updates broadband portal with December 2007 data, OECD 5/22/2008
- Understanding International Broadband Comparisons, NextGenWeb 5/22/2008
- OECD broadband up 18% in 2007 but new report says more could be done, OECD 5/20/2008
- OECD broadband statistics, Telecom Industry and Regulation 12/4/2007
- OECD Broadband Portal, PFF 11/13/2007
- OECD launches new broadband portal, Info and Comm Policy 11/8/2007
- Aiming at the Wrong Target, Verizon 7/24/2007
- Is U.S. broadband access truly lagging?, CNET 7/18/2007
- Broadband prices per megabit around the world, MuniWireless 7/10/2007
- U.S. Improves Broadband Penetration Rankings - By one spot, from 25th to 24th..., DSLreports 8/24/2007
- OECD report on communications convergence and impact on competition, OECD 6/6/2008
- How is the OECD Different From the FCC? OECD Takes It's Number Seriously., Tales from the Sausage Factory 5/30/2007
- OECD Broadband Statistics to December 2006, OECD 4/24/2007
- U.S. Drops Further In Global Broadband Rankings - New OECD data now puts U.S. 15th in broadband penetration, Broadband Reports 4/24/2007
- NTIA Fact Sheet on Broadband Use in the United States, NTIA 4/27/2007
- OECD Broadband Statistics, June 2006, OECD 10/17/2006
- OECD Broadband Statistics, December 2005
- Internet Traffic Exchange: Market Developments and Measurement of Growth, OECD 4/12/2006
- Europe moves to top of OECD broadband rankings, OECD 4/12/2006
- OECD Broadband Statistics, December 2005, OECD 4/12/2006
- Iceland: We're No 1 In Broadband!, Networking Pipeline 4/12/2006
- Global Broadband Stats - U.S. tops in totals, twelfth in penetration, Broadband Reports 4/12/2006
- US really lags in broadband: 12th according to the OECD, Muniwireless 4/12/200
- OECD, ICCP Broadband Update (Oct. 2003)
- International Broadband Penetration as of Dec 2001
| Country | Broadband Households (in thousands) |
Broadband As % if Total Households |
Internet Households (in thousands) |
Internet As % Of total Households |
| United States | 11,200 | 10.4 | 56,376 | 52.3 |
| South Korea | 7500 | 51.7 | 8265 | 57.0 |
| Japan | 2570 | 5.8 | 21497 | 48.2 |
| Canada | 2300 | 19.7 | 6505 | 55.6 |
| Germany | 2090 | 5.4 | 14,858 | 39.1 |
| Taiwan | 112 | 18.2 | 2604 | 42.0 |
| France | 605 | 2.5 | 7448 | 30.4 |
| Netherlands | 550 | 8.1 | 4196 | 61.7 |
| Hong Kong | 545 | 26.0 | 1241 | 59.1 |
| Sweden | 542 | 13.4 | 2546 | 62.1 |
US Department of Commerce (NTIA)
"Today's report shows the nation's broadband success story. The President's policies have made a significant impact on the availability and affordability of broadband in the United States," said U.S. Commerce Secretary Carlos M. Gutierrez. "The broadband policies put in place by the President have created a competitive environment to foster innovation and provide effective technologies, services and cost-effective solutions to revolutionize health care delivery, education, society and the economy. We look forward to continuing our progress on this issue."
Four years ago, President Bush established a national goal of universal, affordable broadband access for all Americans. Since then, the United States has witnessed remarkable results in the growth of the broadband marketplace and the proliferation of broadband platforms and service options. The existing data indicate that broadband is available to the vast majority of U.S. households:
- According to the FCC's 2006 data, broadband service was available in 99 percent of the nation's zip codes, encompassing 99 percent of the nation's population;
- Since President Bush took office, the total number of broadband lines in the United States has grown by more than 1,100 percent from almost 6.8 million lines in December 2000, to 82.5 million in December 2006, according to the most recent FCC data.
- By December 2006, 91.5 percent of ZIP codes had three or more competing service providers and more than 50 percent of the nation's ZIP codes had six or more competitors
The report examines the comprehensive package of technology, regulatory, and fiscal polices implemented by the Administration to lower barriers to investment and create an environment in which broadband innovation and competition can flourish.
ITU
- Broadband: A Platform for Progress, A Report by the Broadband Commission for Digital Develoement, ITU June 2011
- The Broadband Bridge: Linking ICT with Climate Change, March 2012
- ITU: Birth of Broadband, ITU Internet Report, (Sept 2003) Figure 1.3 page 3
- Broadband Adoption Rates Around the World
- Broadband adoption, subscribers per 100 inhabitants, by technology, 2002
- Korea 21.3
- Hong Kong 14.9
- Canada 11.2
- Taiwan 9.4
- Denmark 8.6
- Belgium 8.4
- Iceland 8.4
- Sweden 7.8
- Netherlands 7.2
- Japan 7.1
- United States 6.9
- Austria 6.6
- Switzerland 6.3
- Singapore 5.5
- Finland 5.3
- Birth of Broadband, ITU Internet Report, (Sept 2003) Figure 1.1, page
G7 Countries 4Q01 OECD |
ITU 2002 |
Dec. 2002 OECD XLS |
Dec. 2003 OECD XLS |
ITU 2004 |
Dec. 2004 OECD XLS |
ITU Jan 2005 |
Dec. 2005 OECD XLS |
ITU Jan 2006 |
Dec. 2006 OECD XLS |
Dec. 2007 OECD XLS |
ITIF Composite Score 2007 |
| CAN 8.8 | KOR 21.3 | KOR 21.8 | KOR 24.2 | KOR 24.8 | KOR 24.8 | KOR 24.9 | ICE 26.4 | ICE | DNK 31.8 | DNK 35.1 | KOR 16.0 |
| USA 4.3 | HKG 14.6 | CAN 12.1 | CAN 15.1 | HKG 21.9 | NLD 19.0 | HKG 20.9 | KOR 25.3 | KOR | NLD 31.8 | NLD 34.8 | JPN 15.1 |
| GER 2.3 | CAN 11.5 | BEL 8.7 | ICE 14.3 | NLD 19.8 | DEN 19.0 | NLD 19.4 | NLD 25.22 | NLD | KOR 29.1 | ISL 32.2 | FIN 12.2 |
| JPN 2.2 | TWN 9.4 | ICE 8.5 | DEN 13.1 | DEN 18.9 | ICE 18.2 | DEN 19.3 | DEN 24.9 |
DEN | ICE 28.8 | NOR 31.2 | NLD 11.8 |
| EU 1.5 | ICE 8.6 | DEN 8.3 | NLD 11.8 | ICE 18.4 | CHE 17.6 | CAN 17.6 | CHE 23.8 | HKG | CHE28.3 | CHE 31.0 | FRA 11.6 |
| FRA 1.0 | DEN 8.6 | SWE 8.2 | BEL 11.7 | CAN 17.1 | CAN 17.6 | CHE 17.0 | FIN 22.4 | CHE | NOR 27.4 | FIN 30.7 | SWE 11.5 |
| ITA 0.7 | BEL 8.4 | NET 7.0 | SWE 11.0 | TWN 16.5 | BEL 15.5 | TWN 16.3 | NOR 21.8 | FIN | FIN 27.1 | KOR 30.5 | DEN 11.4 |
| UK 0.6 | SWE 7.7 | USA 6.7 | JPN 10.7 | CHE 16.4 | JPN 15.0 | BEL 16.0 | CAN 20.7 | NOR | SWE 27.1 | SWE 30.3 | ICE 11.2 |
| AUT 6.6 | JPN 6.1 | CHE 10.5 | BEL 15.6 | FIN 14.9 | ICE 15.5 | SWE 20.2 | CAN | CAN 23.6 | LUX 26.7 | NOR 11.1 | |
| NLD 6.5 | CHE 5.6 | USA 9.5 | FIN 15.3 | NOR 14.8 | SWE 15.1 | BEL 18.1 | SWE | BEL 22.3 | CAN 26.6 | CHE 10.8 | |
| USA 6.5 | AUT 5.6 | FIN 9.5 | JPN 15.3 | SWE 14.8 | NOR 15.0 | JPN 17.6 | TWN | UK 21.5 | UK 25.8 | CAN 10.6 | |
| CHE 6.3 | FIN 5.5 | NOR 8.0 | NOR 14.9 | USA 12.7 | ISR 14.3 | UK 16.3 | BEL | USA 20.2 | BEL 25.7 | AUS 10.5 | |
| JPN 6.1 | NOR 4.2 | AUT 7.6 | ISR 14.0 | AUT 10.6 | JPN 14.1 | USA 16.2 | ISR | JPN 20.2 | FRA 24.6 | UK 10.3 | |
| SGP 5.5 | GER 4.0 | FRA 5.9 | SWE 13.7 | FRA 10.5 | FIN 12.8 | FRA 15.1 | JPN | FRA 20.1 | GER 23.8 | LUX 10.3 | |
| FIN 5.3 | ESP 3.0 | GER 5.6 | LIE 13.7 | UK 10.4 | SGP 11.6 | LUX 14.5 | USA | LUX 19.7 | USA 23.3 | USA 10.25 | |
| FRA 2.8 | ESP 5.4 | USA 12.8 | LUX 9.6 | USA 11.4 | AUT 14.3 | AUS 19.0 | AUS 23.3 | GER 10.2 | |||
| PRT 2.5 | UK 5.4 | UK 11.9 | GER 8.4 | FRA 11.2 | AUS 13.6 | AUT 17.2 | JPN 22.1 | BEL 10.2 | |||
| UK 2.3 | PRT 4.8 | SGP 11.9 | PRT 8.2 | UK 10.3 | GER 13.0 | GER 17.1 | AUT 19.6 | PRT 10.2 | |||
| AUS 1.8 | ITA 4.1 | FRA 11.2 | ITA 8.1 | AUT 10.1 | ITA 11.8 | ESP 15.1 | NZ 18.3 | NZ 9.7 | |||
| ITA 1.7 | AUS 3.5 | AUT 10 | ESP 8.1 | PRT 8.5 | ESP 11.5 | ITA 14.3 | IRE 18.1 | ESP 9.7 |
Subs millions Dec. 2007 OECD XLS |
ITIF Lowest Monthly Price per Mbps 2007 | ITIF Ave download speed Mbps |
| USA 70 | JPN 0.13 | JPN 63.6 |
| JPN 28 | KOR 0.37 | KOR 49.5 |
| GER 20 | FRA 0.33 | FIN 21.7 |
| UK 16 | SWE 0.35 | FRA 17.6 |
| FRA 16 | FIN 0.42 | SWE 16.8 |
| KOR 15 | AUS 0.94 | NLD 8.8 |
| ITA 10 | NZ 1.05 | PRT 8.1 |
| CAN 9 | GER 1.10 | POL 7.9 |
| SPA 8 | PRT 1.24 | NOR 7.7 |
| NLD 6 | UK 1.24 | CAN 7.6 |
| AUS 5 | GRE 1.41 | AUT 7.2 |
| MEX 5 | DEN 1.65 | BEL 6.3 |
| TUR 4 | LUX 1.85 | ICE 6.1 |
| POL 3 | NLD 1.9 | GER 6.0 |
| SWE 3 | ITA 1.97 | USA 4.9 |
| BEL 3 | ESP 2.27 | DEN 4.6 |
| CHE 2 | NOR 2.74 | ITA 4.2 |
| DNK 2 | USA 2.83 | SLO 3.5 |
| AUT 2 | CHE 3.4 | HUN 3.3 |
| FIN 2 | BEL 3.58 | LUX 3.1 |
Comment Sought On International Comparison And Consumer Survey Requirements In The Broadband Data Improvement Act GN Docket No. 09-47
Comment Date: April 10, 2009 Reply Comment Date: April 17, 2009 In this Public Notice, we seek comment on how the Commission should implement sections 103(b) and 103(c)(1) of the Broadband Data Improvement Act (BDIA). These sections impose new broadband data collection and reporting obligations on the Commission by requiring the Commission to include an international comparison in its annual broadband report and to conduct a consumer survey of broadband service capability.
Specifically, s ection 103(b) of the BDIA provides:
(b) INTERNATIONAL COMPARISON.-
(1) IN GENERAL.-As part of the assessment and report required by section 706 of the Telecommunications Act of 1996 (47 U.S.C. 157 note), the Federal Communications Commission shall include information comparing the extent of broadband service capability (including data transmission speeds and price for broadband service capability) in a total of 75 communities in at least 25 countries abroad for each of the data rate benchmarks for broadband service utilized by the Commission to reflect different speed tiers.
(2) CONTENTS.-The Commission shall choose communities for the comparison under this subsection in a manner that will offer, to the extent possible, communities of a population size, population density, topography, and demographic profile that are comparable to the population size, population density, topography, and demographic profile of the various communities within the United States. The Commission shall include in the comparison under this subsection-
(A) a geographically diverse selection of countries; and
(B) communities including the capital cities of such countries.
(3) SIMILARITIES AND DIFFERENCES.-The Commission shall identify relevant similarities and differences in each community, including their market structures, the number of competitors, the number of facilities-based providers, the types of technologies deployed by such providers, the applications and services those technologies enable, the regulatory model under which broadband service capability is provided, the types of applications and services used, business and residential use of such services, and other media available to consumers.
The Commission invites parties to comment on how the Commission can effectively implement the international comparison of broadband service capability, including speeds and prices, required by section 103(b). We seek comment on the criteria in section 103(b)(2) for the identification and selection of the communities to be included in the survey. We seek comment on the enumerated indicators in section 103(b)(3) for the identification of "relevant similarities and differences in each community" as well as any additional indicators that commenters seek to propose. We also seek comment on all possible sources of data that the Commission should examine in the course of implementing this section of the BDIA. Finally, we seek comment on any other factors or issues the Commission should consider in implementing section 103(b) of the BDIA.
Section 103(c)(1) of the BDIA provides:
(c) CONSUMER SURVEY OF BROADBAND SERVICE CAPABILITY.-
(1) IN GENERAL.-For the purpose of evaluating, on a statistically significant basis, the national characteristics of the use of broadband service capability, the Commission shall conduct and make public periodic surveys of consumers in urban, suburban, and rural areas in the large business, small business, and residential consumer markets to determine-
(A) the types of technology used to provide the broadband service capability to which consumers subscribe;
(B) the amounts consumers pay per month for such capability;
(C) the actual data transmission speeds of such capability;
(D) the types of applications and services consumers most frequently use in conjunction with such capability;
(E) for consumers who have declined to subscribe to broadband service capability, the reasons given by such consumers for declining such capability;
(F) other sources of broadband service capability which consumers regularly use or on which they rely; and
(G) any other information the Commission deems appropriate for such purpose.
The Commission invites parties to comment on how the Commission can effectively implement the survey requirements in section 103(c)(1), including any factors or issues the Commission should consider as part of this implementation.
Broadband Data Improvement Act of 2008, Pub. L. No. 110-385, 122 Stat. 4097 (codified at 47 U.S.C. §§ 1301-04).
BDIA § 103(b); 47 U.S.C. § 1303(b).
BDIA § 103(c)(1); 47 U.S.C. § 1303(c)(1).
We recognize that, while the Commission previously raised related issues of whether and how the Commission should undertake broadband customer surveys in a pending proceeding, the BDIA mandates that we conduct and publish such a survey. See Development of Nationwide Broadband Data to Evaluate Reasonable and Timely Deployment of Advanced Services to All Americans, Improvement of Wireless Broadband Subscribership Data, and Development of Data on Interconnected Voice over Internet Protocol (VoIP) Subscribership , WC Docket No. 07-38, Report and Order and Further Notice of Proposed Rulemaking, 23 FCC Rcd 9691, 9712, para. 40 (2008).
Released: 03/31/2009. COMMENT SOUGHT ON INTERNATIONAL COMPARISON AND CONSUMER SURVEY REQUIREMENTS IN THE BROADBAND DATA IMPROVEMENT ACT. (DA No. 09-741). (Dkt No 09-47). Comments Due: 04/10/2009. Reply Comments
Due: 04/17/2009. WCB. Contact: Randy Clarke or Jeremy Miller at 0940
TXTx
Analysis and Criticism of Internet Rankings and Statistics
Differences between countries
- General variables / differences
- Countries with "robust national broadband strategies" fare better then those countries without
- Levels of competition matter
- Demand side issues matter such as ownership of computers
- Per capita income
- Percent of the population that are internet users
- Price of broadband
- Median age of population
- Teledensity
- 50% of South Korea live in high teledensity, large apartment buildings - the cost of deployment of infrastructure to these apartment buildings is significantly less than deployment to single homes or more suburban environments. [ITIF VII, p. 10]
- The USA has large rural areas with low teledensity, making infrastructure deployment expensive.
- The USA has the longest copper loop lengths of the 13 OECD countries where this data is available - making DSL deployment expensive and difficult. [ITIF VII]
- Govt Policy
- Government incentives are a factor
- "S. Korean government's certificant system, implemented in 1999 for broadband Internet-equipped buildings to expedite expansion of broadband Internet services . . . requires all newly constructed buildings in S Korea to be designed to enable high speed broadband connections, such as locating DSL access multiplexers (DSLAMs) or cable head-ends in apartment basements." [ITIF p 10]
- In Japan, the govt has a significant ownership interest in the telecom provider NTT
Problems with Methodology
- USA Today article appears to compare actual delivered US speeds with advertised speeds in other countries. [Hoewing Verizon]
- Intl Comparisons do not reflect upstream speeds. [Hoewing Verizon]
- "The principal limitation of the OECD rankings are that they measure penetration on a per capita basis rather than a per household basis. When measured on a household basis, the US rank improves somewhat, to 12th " (from 15th in 2007) [ITIF 5]
- OECD fails to include WiFi Hot Spots and at work access
News
| Income | Have BB | Want BB | Not Online |
| < $35,000 | 4% | 12% | 70% |
| $35k - 50k | 11% | 20% | 51% |
| $50k-$75K | 14% | 24% | 40% |
| $75k-$100k | 17% | 30% | 29% |
| Over $100k | 28% | 37% | 15% |
| Mean | $69,2000 | $62,700 | $41,700 |
Page 7
- U.S. Broadband Growth Slows, Reuters 8/18/2004
- More high-speed Net subscribers in US, NUA 4/4/03
- Survey Finds Broadband’s on the Mind of Residential Builders and Developers, InStat 3/24/03
- More broadband users in the US (33.6m Dec 2002), NAU 1/17/03
- Broadband Broadens its Pitch Wash Post Feb 2 2003 (available to 70% americans with a 13% take rate)
- As Broadband Gains, The Internet's Snails Fall Back NYT Feb 2003
- U.S. Broadband Growth Steady (28% US HH have Broadband, DSL or cable is available to 88% of HH, cable has 54% market share, DSL has 34% market share June 2002 source Gartner), ISP Planet 11/20/02
- e-Data Telecom: Broadband Internet Tops 15.6 Million in the U.S. - Subscriptions Jump 11% in 90 Days, ITAA 11/20/02
- Broadband adoption rise in North America, NUA 12/4/02
- Over 15 million broadband subscribers in US NUA 11/8/02
- Broadband in 25 % of online households in US NUA 10/28/02
- Broadband Hooks Up 13.1 Million Users ISP Planet 10/18/02
- US online households embrace broadband (28% US Online HH have Broadband - BB Market: ISDN 8%, 54% cable, DSL 34% market) - June 02 NUA 11/15/02
- U.S. Cable vs. DSL, Second Q 2002, Cyberatlas 8/23/02
- Broadband users use the Net differently, NUA 6/24/02
- Broadband Growth is Booming - NIELSEN//NETRATINGS Finds 65% of the Top 20 Local Markets Grow at Least 48 Percent in Past Year, ITAA 6/26/02
- Use of Internet Is More Active at High Speed, NYT 6/24/02
- Study: Broadband Adoption on the Rise, Newsfactor 6/24/02
- Broadband Fees Up; Adoption Rates Down, Cyberatlas 1/17/02
- Cable Widens Lead In High-Speed Race, INews 11/1/01
- 35 Million Broadband Users By 2006, Cyberatlas 10/18/01
- Report to the Governor in Council: Status of Competition in Canadian Telecommunications Markets Deployment/Accessibility of Advanced Telecommunications Infrastructure and Services September 2001
Global Broadband
- Broadband Europe 2007, Europa 8/9/2007
- World Broadband Statistics: Q4 2005, Point Topic Ltd (March 2006)
- World broadband maps Q4 2005 April 2006 Point Topic
- China to Top U.S. in Broadband Subscribers, Americas Network 5/17/2005
- Global Broadband Tops 123M, Clickz 9/21/2004
- Technology Administration, Department of Commerce, Understanding Broadband Demand, A Review of Critical Issues , page 5 (Sept 23, 2002)
- World Broadband Subscribers RHK Inc. www.rhk.com 4Q 2003
- Cable: 32,857,000 - DSL: 65,714,000 - Other: 1,377,000
Broadband Adoption By Service by Percentage
NB: Some surveys contrast all types of Internet access (including dial up), some only contrast DSL to Cable.
-The 2007 Digital Economy Fact Book, Progress and Freedom Foundation p. 17 (Dec. 2007) ( PDF ) Vermont Telecommunications Plan, Sept 2004 p. 4-29 (Vermont Residents) Cable represented 75.3% of advanced service lines, ADSL represented 14.9%, and other technologies represented 9.8% in December 2003. The relative position of cable and ADSL was 56% and 16.8% in June 2001. Cable represented 58% of high speed lines, with ADSL representing 34% as of year-end 2003. Pew Internet Project reported in April 2004 that 42% of broadband users at home connected via DSL, compared to 28% a year previously. [p.30] [p.29] FCC Fourth Sec. 706 Report (Sept. 2004)
Plan to Adopt Soon
Vermont Residents Likely to Upgrade to faster Internet connection in the next year: Yes 23% : No 67% Dont Know 10%. Vermont Residents without home Internet access likely to acquire it in the next year: Yes 23%: No 69% : Dont Know 7% : Refused 1%.Vermont Telecommunications Plan, Sept 2004 p. 4-27
Demographics
- Pew Internet Project, Digital Divisions
- Pew Internet Project, Internet: The Mainstreaming of Online Life, p. 67
Broadband by Location
Broadband at Home
- Residential Broadband Penetration by Region Jan 2005. Leichtman Research Group, p. 4 (Sept 2005) http://www.leichtmanresearch.com/research/notes09_2005.pdf
Refusniks
- Explaining Dial-Up Laggards - Poor, retired, can't read or just don't care..., DSLreports 9/4/2007
- Offline Americans see Internet of Little Value, Park Assoc 3/27/2007
- US Internet Adoption to Slow, Clickz (February 2006)
- More refuseniks than dial up users. 72 m v 62 m. Pew 2004.
- A Nation Online: Entering the Broadband Age, Department of Commerce (Sept. 2004)
- Reasons for not having Internet connections at home. Vermont Telecommunications Plan, Sept 2004 p. 4-30 Reasons for not subscribing to a faster Internet access service. p. 4-31.
- Year Three of the UCLA Internet Report, UCLA Page 28 1/31/03
Percent of Non Users 2000 2001 2002 No Computer 37.7 25.5 28.5 No Interest 33.3 21.4 23 Dont Know How 18.9 6.9 15.4 Too Expensive 9.1 2.6 9.6 Fear of Tech 4.2 5.6 2.6 Privacy Security Concerns 2.9 1.6 0.8 Not Appropriate for Kids 1.9 0.8 1.4 Computer Not Good Enuf 1.4 1.2 3.4 Consumes too much time 0 1.6 3.6 Availability
- FCC Fourth Sec. 706 Report (Sept. 2004)
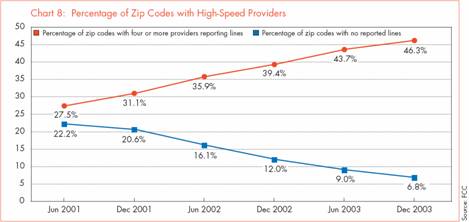
- As of December 2003, only 6.8% of zip codes reported no high-speed lines, compared to 22.2% of zip codes with no reported lines in June 2001. There also has been a steady growth in the percent of zip codes reporting four or more providers of high-speed lines, from 27.5% in June 2001 to 46.3% in December 2003. With respect to the lowest density zip codes (fewer than six persons per square mile), there were reported lines in 73% of zip codes in December 2003, compared to 37% in June of 2001. [p.30]
 [p.30]
Value of Bits: Cost Per Megabyte of Various Services
Service Typical Monthly Bill Revenue Per MB Cable Broadband Internet Phone Dial Up Internet Cell Phone SMS
Source: Andrew Odlyzko, Pricing and Architecture of the Internet: Historical Perspectives from Telecommunications and Transportation, p. 4 (TPRC 2004)
Download Speeds
- Download time of a 2-begabyte file for various Internet Connections
- Transfer time, 3 megabyte file, hours/seconds
- 56 kbps - 7 min 15 sec
- 128 kbps - 3 min 7 secs
- 258 kbps - 1 min 33 secs
- 512 kbps - 47 secs
- 1.5 mbps - 16 secs
- 2 mbps - 12 secs
- 10 mbps - 2.4 secs
- 100 mbps - 0.24 secs
x1000Comcast TW Cable Cox Charter Cablevision Adelphia Bright House Mediacom Insight RCN CableOne Other Total
Wifi
Wireless
- Wireless Subscriptions Market Share by Carrier in the U.S., STATISTA (Apr. 2021)
- John Horrigan, Mobile Access to Data and Information
- US Wireless Forecast, 2008 to 2013: Reaching the Tipping Point for Mobile Data Services, Jupiter 7/31/2008
- Wireless Internet Use, Pew Internet 7/30/2009
- Mobile Internet Users to Reach 134 Million by 2013, CircleID 6/11/2009
- U.S. 3G Adoption Rivals Europe, Tech Industry and Regulation 9/10/2008
- U.S. Wireless Internet Access Tops the Charts, CTIA 7/14/2008
- US Wireless Forecast, 2008 to 2013: Reaching the Tipping Point for Mobile Data Services, Jupiter 7/31/2008
- Seeding The Cloud: What Mobile Access Means for Usage Patterns and Online Content, Pew 3/7/2008
- Mobile Access to Data and Information, Pew 3/7/2008
- Mobile broadband use jumps 154 percent, CNET 3/5/2008
| 2002E | xDSL | Cable |
| Total Costs | $47 | $40 |
| Transport/network | 2 | 4 |
| ISP/Hosting | 5 | 5 |
| Customer Acquisition |
15.5 | 14.0 |
| CPE | 4.5 | 3 |
| Home Installation | 5 | 6 |
| Customer Service/Billing |
11 | 7 |
| Maintenance | 4 | 1 |
Costs are for ILEC. Excludes CLEC UNE costs. Source: McKinsey and JFMS analysis 2001.
© Cybertelecom ::