 |
Cybertelecom
Federal Internet Law & Policy
An Educational Project
|
|
Statistics: Schools & Libraries |
Statistics: Universal Service

Our . . . challenge is to provide Americans with the educational opportunities we'll all need for [the 21st] century. In our schools, every classroom in America must be connected to the information superhighway with computers and good software and well-trained teachers. We are working with the telecommunications industry, educators, and parents to connect . . . every classroom and every library in the entire United States by the year 2000. -- President Clinton's State of the Union Address, January 23, 1996.
National Fact Sheet, Children's Partnership (2002)
Universal Service
- FCC Fourth Sec. 706 Report (Sept. 2004)
- Rural carriers receive more than $1 billion annually in universal service support for their underlying copper loop network. [p.32]
- Since 1998, the universal service fund has disbursed more than $55 million to support broadband connections to rural health facilities. USAC estimates that the fund will provide more than $28 million in Funding Year 2003 alone to help provide assistance for rural health care connections in remote communities, and potentially an even larger amount in Funding Year 2004. [p.32]
- In 2002, more than 75% of U.S. households with incomes of more than $50,000 had Internet access, but the share was 38% for those with household incomes of less than $30,000, according to a survey by the Pew Project… Our data indicate that the gap between subscribership in the highest income zip codes ($53,494 and higher) and the lowest income zip codes ($21,644 and lower) has shrunk from about 37 to 17%age points, primarily due to increases in subscribership among low-income zip codes. In particular, our most recent data indicate that, in December 2003, approximately 99% of the highest income zip codes reported high-speed lines and almost 82% of the lowest income zip codes reported high-speed lines. By contrast, the Third Report indicated that as of June 2001, of the highest income zip codes, 96% had high-speed subscribers, while of the lowest income zip codes, 59% had highspeed subscribers. [p.34-35]
- According to a May 2004 study by the Pew Project of adults, 61% of non-Hispanic Caucasians, 59% of Hispanics, and 52% of African- Americans used the Internet as of February 2004. Further, research by the Pew Project indicates that, in 2001, 20% of Hispanic adult home Internet users had broadband access, 15% of non- Hispanic Caucasian adult home Internet users had broadband access, and 9% of African-American adult home Internet users had broadband access. In 2003, 30% of non-Hispanic Caucasian adult home Internet users had broadband access, 24% of Hispanic adult home Internet users had broadband access, and 20% of African- American adult home Internet users had broadband access. Moreover, as noted above, the use of broadband in schools with the highest minority enrollment increased from 81% to 95% between 2000 and 2002. [p.36-37]
Erate
- Internet Access in U.S. Public Schools and Classrooms: 1994-2002, ED 11/17/2003
- US Schools All But Wired Cyberatlas 2/24
- Study: U.S. Schools 95 Percent Wired The Industry Standard 2/18
- Nearly all U.S. schools now have Internet access, survey finds NandoTimes 2/17
- Most public schools connected to Net USA Today 2/17
- 95 Percent Of Public Schools Now Net-Connected - Report Newsbytes 9/11
Access to the Internet in Schools
In 2002, 99% of public schools had access to the Internet, compared to 35% in 1994. [p.33, 34]
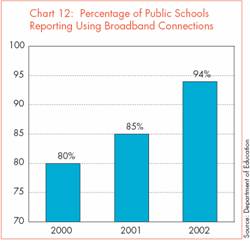
In 2002, 94% of public schools reported using broadband connections for Internet access, compared to 80% in 2000 and 85% in 2001. In 2002, as in previous years, the use of broadband connections is directly related to school size; 90% of small schools reported using broadband connections to access the Internet, compared with 100% of the large schools. Most notably, the use of broadband connections in schools with the highest minority enrollment increased from 81% to 95% between 2000 and 2002. Similarly, during the same time period, the percentage of schools with the highest poverty concentration (as measured by the percent of students eligible for free or reduced-price lunch) using broadband connections to access the Internet increased from 75% to 95%. [p.10, 33, 34]
According to the Department of Education, Internet access using broadband connections has increased from 75% in 2000 to 95% in 2002 among the schools with the highest poverty concentration. [p.36]
 [p.33]
Classrooms
More than 92% of public school classrooms have Internet access. [p. 10]. compared to 3% in 1994 and 77% in 2000. [p.33, 34]
[p.33]
Classrooms
More than 92% of public school classrooms have Internet access. [p. 10]. compared to 3% in 1994 and 77% in 2000. [p.33, 34]
Year Three of the UCLA Internet Report, UCLA Page 65 1/31/03
Internet Use by Children at school. 2000: 52.7%. 2001: 63.6%. 2002: 73.3%
Pew Survey: College Net Use At 86%, MSNBC 9/16/02
Web Is a Vital College 'Utility,' Study Reports, Wash Post 9/16/02
The Internet and Education: Findings of the Pew Internet & American Life Project, Pew 9/6/01
National Center for Education Statistics released a new report on Internet Access in US Public Schools and Classrooms 1999-2000 in May 2001
Urban Institute, E-Rate and the Digital Divide: A Preliminary Analysis From the Integrated Studies of Educational Technology, Sept 20, 2000
Department of Education, Internet Access in U.S. Public Schools and Classrooms: 1994-1999, January 2000.
| Year |
Percent
Schools
Wired |
Percent
Classrooms
Wired |
| 1994 |
35 |
3 |
|
1995
|
50 |
8 |
| 1996 |
65 |
14 |
| 1997 |
78 |
27 |
| 1998 |
89* |
|
| 1999 |
93* |
|
| 2000 |
95* |
|
| 2001 |
|
|
*Projected numbers. Source: U.S. Department of Education, National Center for Education Statistics, Digest of Education Statistics 1997, 458 Figure 33 & table 415 (December 1997) (Mean number of all computers per school 1995: 72. Percent of computers with Internet access, 1995: 14. Mean number of computers with Internet access in schools with Internet access, 1995: 12.); Issues Brief: Internet Access in Public Schools, National Center for Education Statistics, US Department of Education (February 1998).
School
Characteristics |
1994 |
1995 |
1996 |
1997 |
| All Public Schools |
35 |
50 |
65 |
78 |
| Minority Enrollment |
|
|
|
|
| Less than 6 percent |
- |
52 |
65 |
84 |
| 6 to 20 percent |
- |
58 |
72 |
87 |
| 21 to 49 percent |
- |
54 |
65 |
73 |
| 50 percent or more |
- |
40 |
56 |
63 |
Students eligible for free or
reduced-price lunch |
|
|
|
|
| Less than 11 percent |
- |
62 |
78 |
88 |
| 11 to 30 percent |
- |
59 |
72 |
83 |
| 21 to 70 percent |
- |
47 |
58 |
78 |
| 71 Percent or more |
- |
31 |
53 |
63 |
Source: Issues Brief: Internet Access in Public Schools, National Center for Education Statistics, US Department of Education (February 1998).
"How do we make sure this revolution in communications helps people not just in Montgomery County but also in downtown Baltimore? Because, let's face it. That's not happening right now. Not when 78% of schools in affluent communities have Internet access -- but only half the schools in low-income areas have access. Not when the percentage of white children with home computers is trible the percentage of black and Latino kids. This is what I call the digital divide. . . . But today, only 5% of minority classrooms are hooked up to the Internet." William E. Kennard, Bridging the Digital Divide (May 15, 1998).
Students per Computer
"The average ration of students to computers is now 7.3-to-1, compared with 25-to-1 a decade ago. The U.S. Education Department has a 5-to-1 goal." - Schools struggle to train teachers to use technology, USA Today 2D (December 17, 1997)
"In the 1993-94 school year, for instance, schools where 80 percent or more of their students were eligible for Title I had one computer for every 26 students, while schools where just 20 percent of students were eligible for Title I had one computer for every 13 students, according to Quality Education Data. But by the 1995-96 school year the gap had narrowed substantially, with the poorest schools reporting one computer for every 13 students, and the wealthiest one of every 10 students." -- The Benton Foundation, The Learning Connection: Schools in the Information Age, An Education Technology Agenda (Last updated 10 September 1997).
Students per computer. 91-92 (19.2); 92-93 (12); 93-94 (10.8); 94-95 (9.1); 95-96 (9); 96-97 (7.3). Techno-Savvy schools, USA Today 4D December 17, 1887 (Source: Market Data Retrieval Inc).
"The ratio of students per computer declined from 36.5 a decade ago to 19.3 five years ago and 7.3 in the last school year." The boom goes on - and so do the inequities, electronic school A12 September 1997 (Source: Technology in Education: Advance Report")
"However the study shows, schools with low minority enrollments have more computers available for their students. Schools with less than 5 percent minorities have a ration of 6.6 students per computer; those where more than half the students are minorities have a ratio of 8.4 students per computer. . . Similarly, while Internet access in schools has gone up, the lion's share of the access is in wealthier schools, the study discovered. The percentage of schools with Internet access went from 32 percent in 1995-96 to 70 percent last year. ¶ In affluent neighborhoods, the figure is 78 percent, compared with 69 percent for blue-collar neighborhoods and 66 percent in rural areas. Among schools with less than 5 percent minority enrollment, 72 percent have Internet access, compared with only 65 percent of the schools with more than 50 percent minorities." - The boom goes on - and so do the inequities, electronic school A12 September 1997 (Source: Technology in Education: Advance Report")
Libraries
- Links
- Public Libraries & the Internet FSU
- Reports
- Public Libraries and the Internet 2006: Study Results and Findings
 (1.16 MB) By John Carlo Bertot, Charles R. McClure, Paul T. Jaeger, & Ryan J. (Sep 2006)
- Toward Equality of Access: The Role of Public Libraries in Addressing the Digital Divide, Bill and Melinda Gates Foundation
- FCC Fourth Sec. 706 Report (Sept. 2004)
- According to the Gates Foundation, in 2002, 95% of public libraries in the United States offered free access to the Internet. [p.10, 36]
- "In 1997, 3 out of 4 library systems were connected to the Internet. Of those that were connected, 80 percent offer public access to the Net. Almost 3 out of 5 public library systems offer some type of Internet access directly to the public. In central cities, about 1 in 3 public systems offer access in some or all of their branches to the Web. In contract, in rural areas, less than 1 in 10 of public library systems offer web access in some or all of the branches." -Remarks by Larry Irving, Assistant Secretary for Communications and Information, National Telecommunications and Information Administration, Department of Commerce, Progress Report: Assessing the Impact of Existing Universal Service Policies and Infrastructure Grants in Connecting Americans, Connecting All Americans for the 21st Century Conference (February 25, 1998).
Interest in Government Funding